Exploratory Analysis
Exploring the change of Vaping and other drug use over Time
In order to analyze the change of vaping and other drug usage over time in NYC’s youth, we created the following animated plot:
Interpretation
After analyzing the plot, we drew the following conclusions:
Among the five types of drugs considered, alcohol has the highest proportion in year 2003, but started decreasing in use from 2007 onwards across all five boroughs in NYC. In addition, cigarette has a lower total proportion than alcohol but a similar decreasing trend after 2009.
Cigar maintains a steady but low-proportion trend during 2003-2017, which could be compared with marijuana holding a steady but higher proportion in total. Moreover, the marijuana use in Manhattan increased from the lowest level in 2007 to the highest level in 2011 among five boroughs.
Staten Island had the highest Marijuana use over the years among all five NYC boroughs. However, in year 2017, it dropped dramatically and had the lowest proportion among all boroughs. Overall Marijuana stayed almost the same among all boroughs over the years.
Vaping, which is our main drug of interest, has a slightly increasing trend from 2015-2017. This trend is quite similar to the alcohol, cigar and cigarette trend observed from 2003 to 2005. Moreover, vaping has a proportion about as high as the proportion observed in marijuana in 2015-2017, which indicates that it could possibliy grow into a new drug threatening public health.
Exploring the change of Mental Health over Time
In order to analyze the change of mental health status of NYC’s youth over time, we created the following animated plot:
Interpretation
Examining this plot, we determined the following:
Teenagers, feeling sad and hopeless, constitute the highest proportion among all three mental health issues considered. Based on the considered survey data, we see that a high percentage of teenagers do not have a positive mood. The trend decreases slightly after 2009, just to pick up again in 2015. Staten Island has the lowest proportion in the reported sadness with the exception of 2011. Bronx almost alwyas has the highest proportion, and Queens fluctuates greatly.
The proportion of attempted suicide is approximately constant at about 0.1 and is higher than the proportion associated with getting injured due to an attempted suicide. Both attempted suicide and injurious attempted suicide are relatively steady over time and have about the same magnitude across all five NYC boroughs.
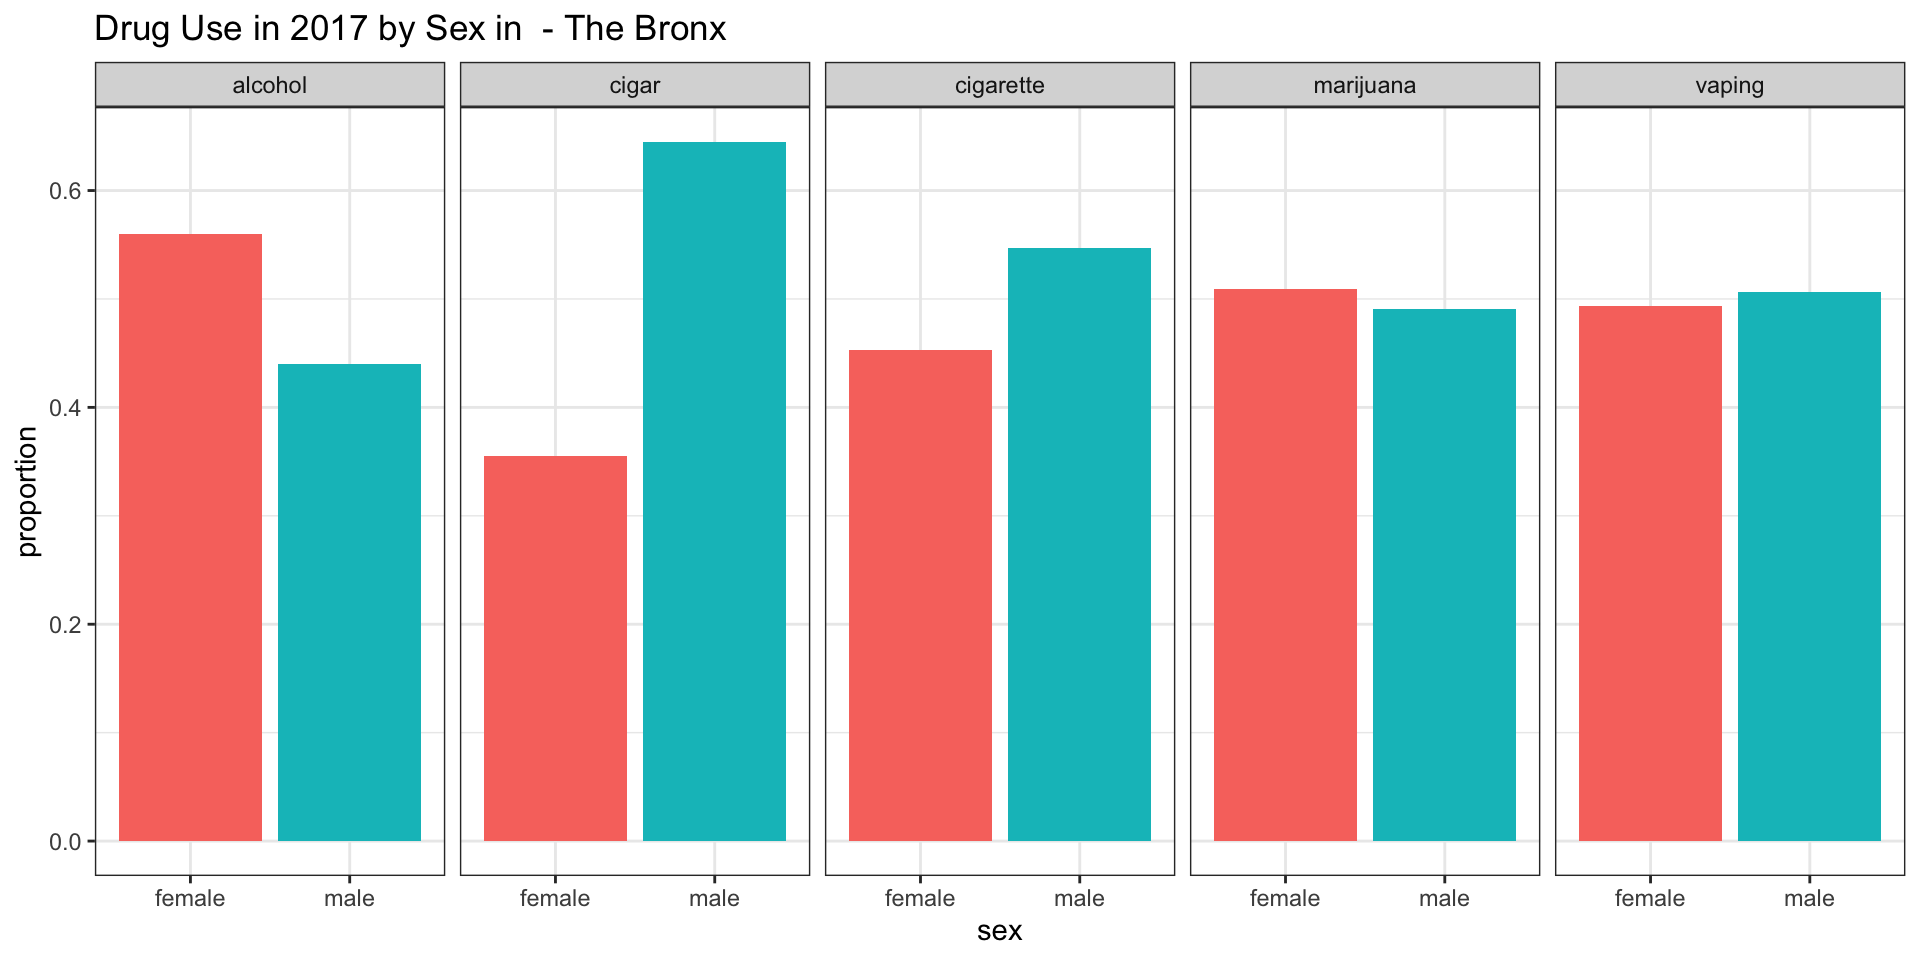
Exploring the distribution of sex for each particular drug in 2017 across all boroughs
We were interested in the distribution of sex for each particular drug in different boroughs of NYC in 2017. To that end, we created the following plots:
Note that the plots show only data for teenagers consuming the particular drug of interest.
Bronx
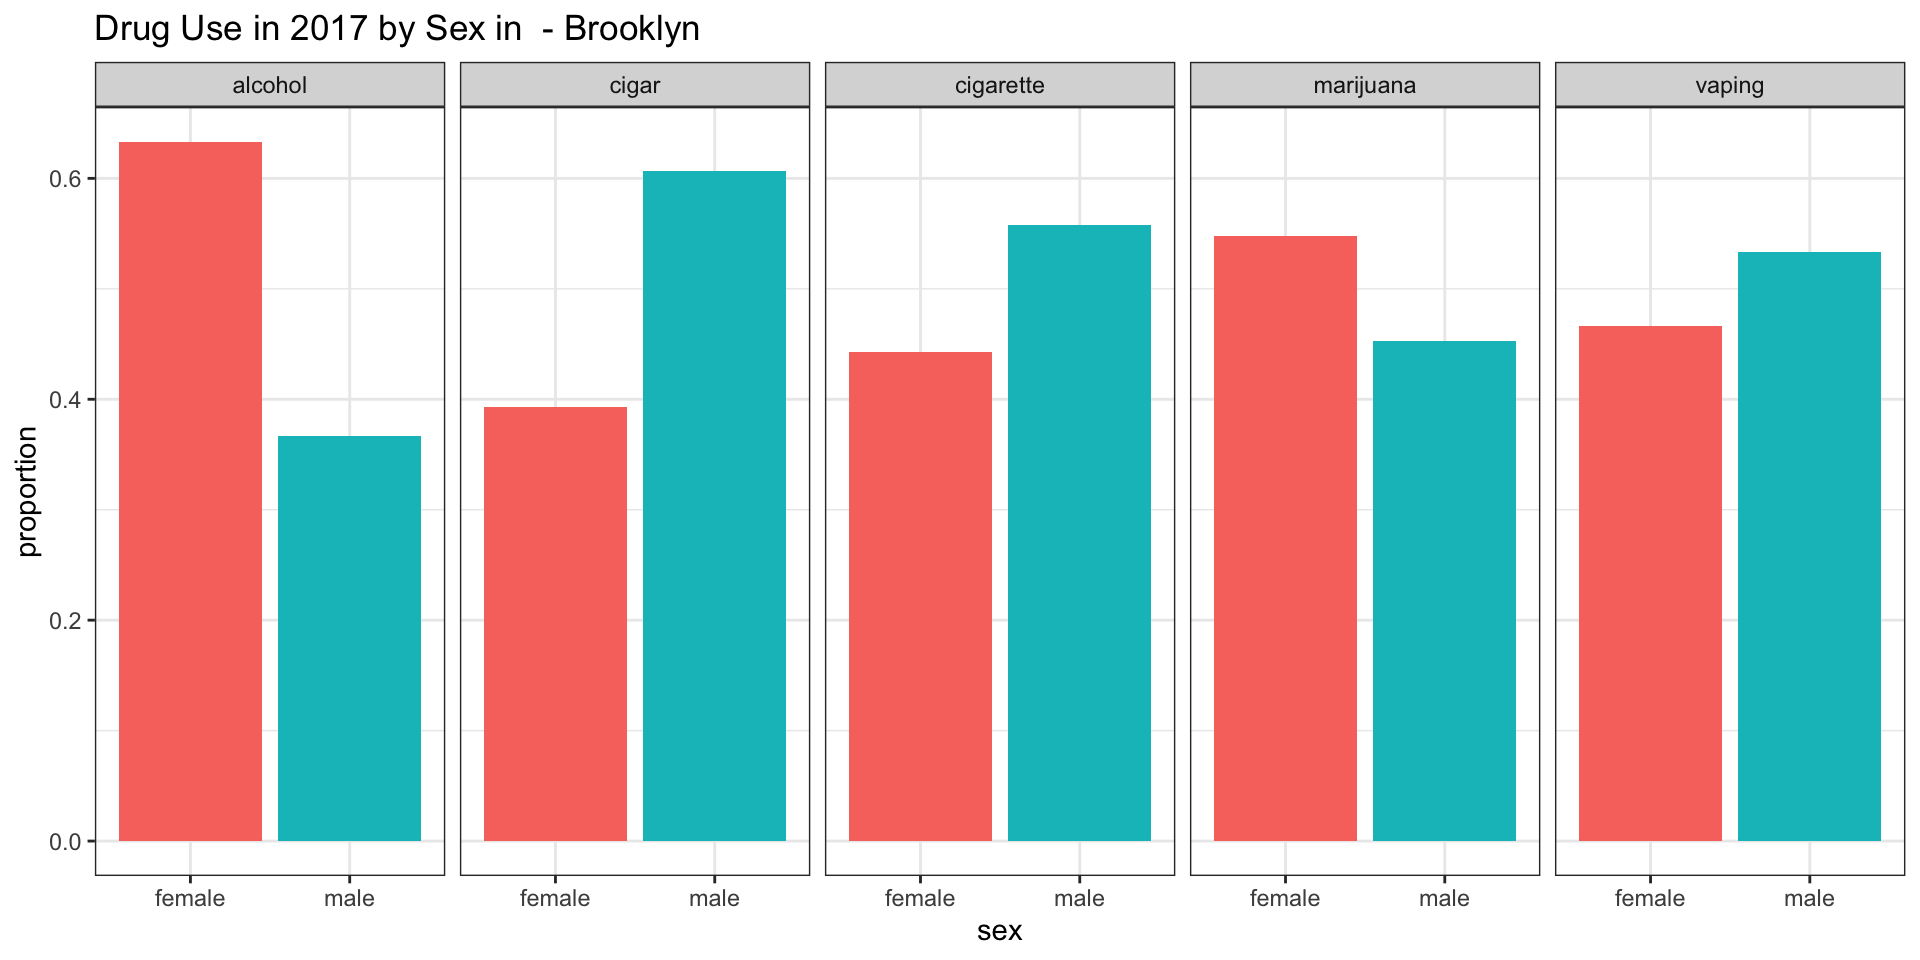
Brooklyn
Manhattan
Queens
Staten Island
Interpretation
Studying these plots, we were able to derive the following interesting results:
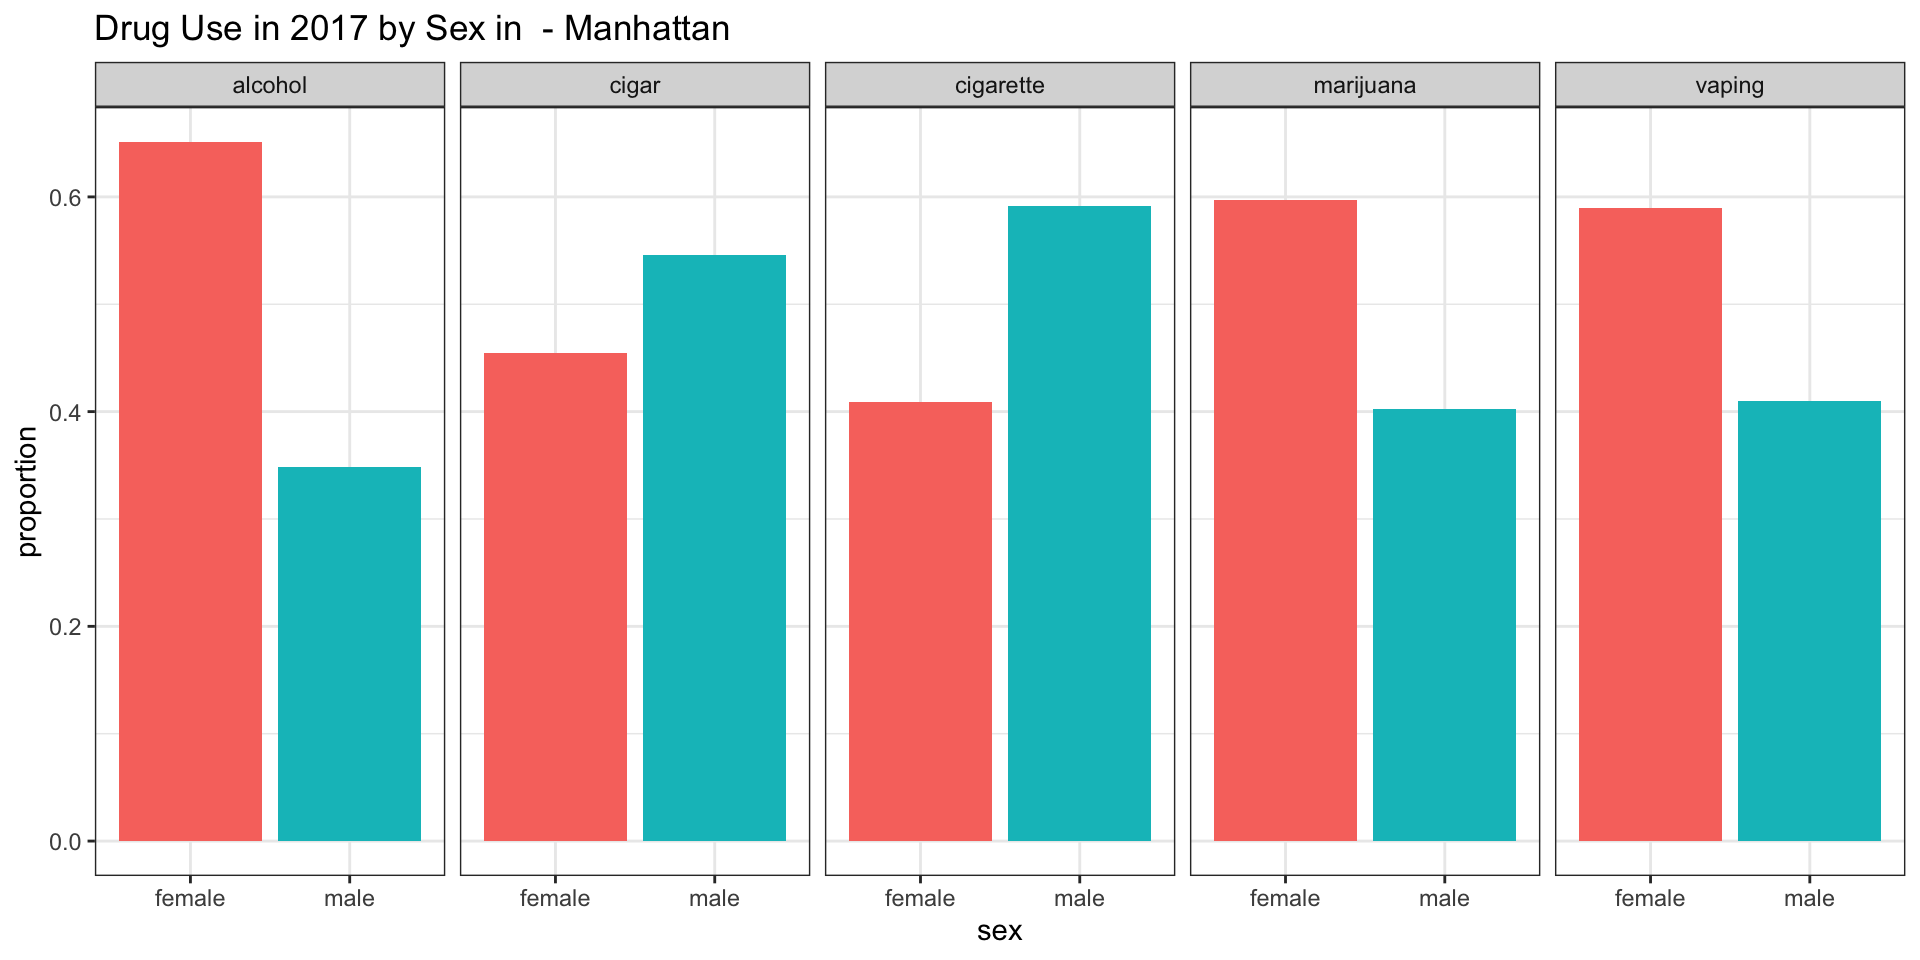
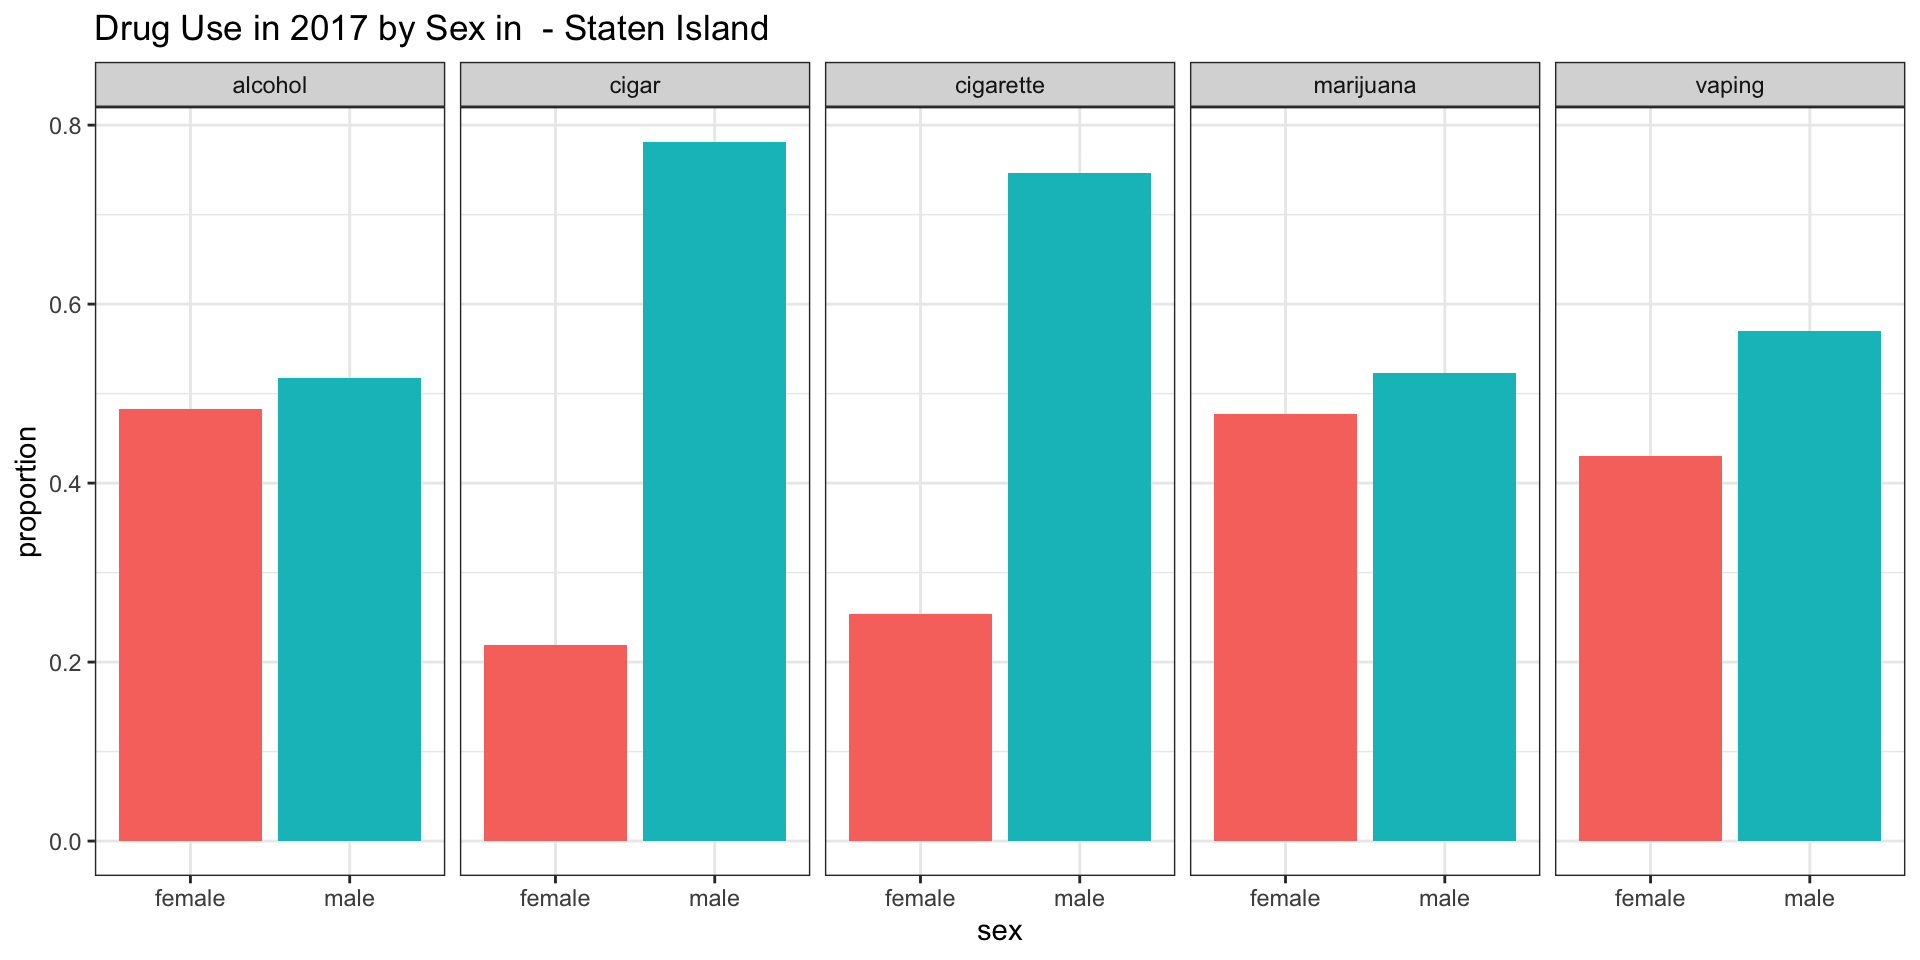
According to our survey data, it appears as if the consumpution of alcohol is more common among female teenagers in all boroughs except for Staten Island.
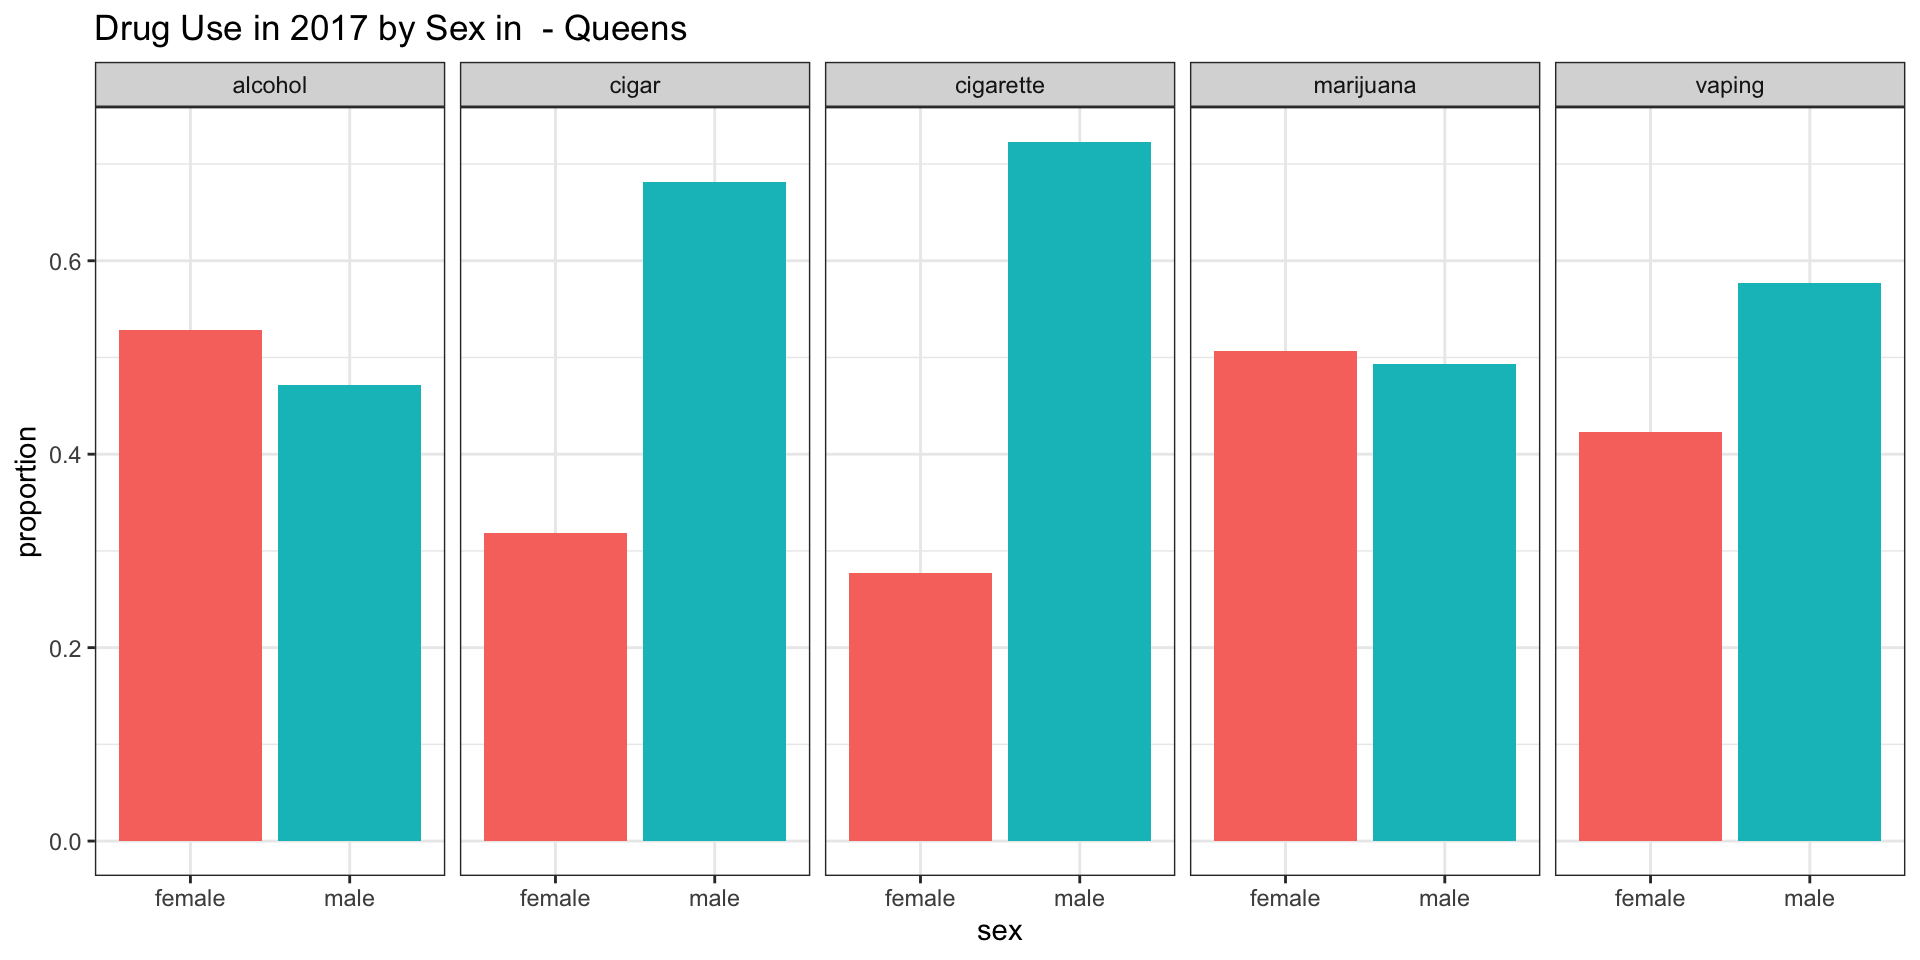
According to our survey data, it appears as if cigars are more smoked among male teenagers in all boroughs.
According to our survey data, it appears as if cigarettes are more smoked among male teenagers in all boroughs.
According to our survey data, it appears as if there is no difference in marijuana usage between the genders in the Bronx and Queens.
According to our survey data, it appears as if marijunana is more smoked among female teenagers in Brooklyn and in Manhattan.
According to our survey data, it appears as if marijunana is more smoked among male teenagers in Staten Island.
According to our survey data, it appears as if there is no difference in vaping between the genders in the Bronx.
According to our survey data, it appears as if there is more vaping present among male teenagers in Brooklyn, Queens, and Staten Island.
According to our survey data, it appears as if there is more vaping present among female teenagers in Manhattan.
Exploring the distribution of being involved in a fight for each particular drug in 2017 across all boroughs
We were interested in the distribution of being involved in a fight for each particular drug in different boroughs of NYC in 2017. To that end, we created the following plots:
Note that the plots shows only data for teenagers consuming the particular drug of interest.
Bronx
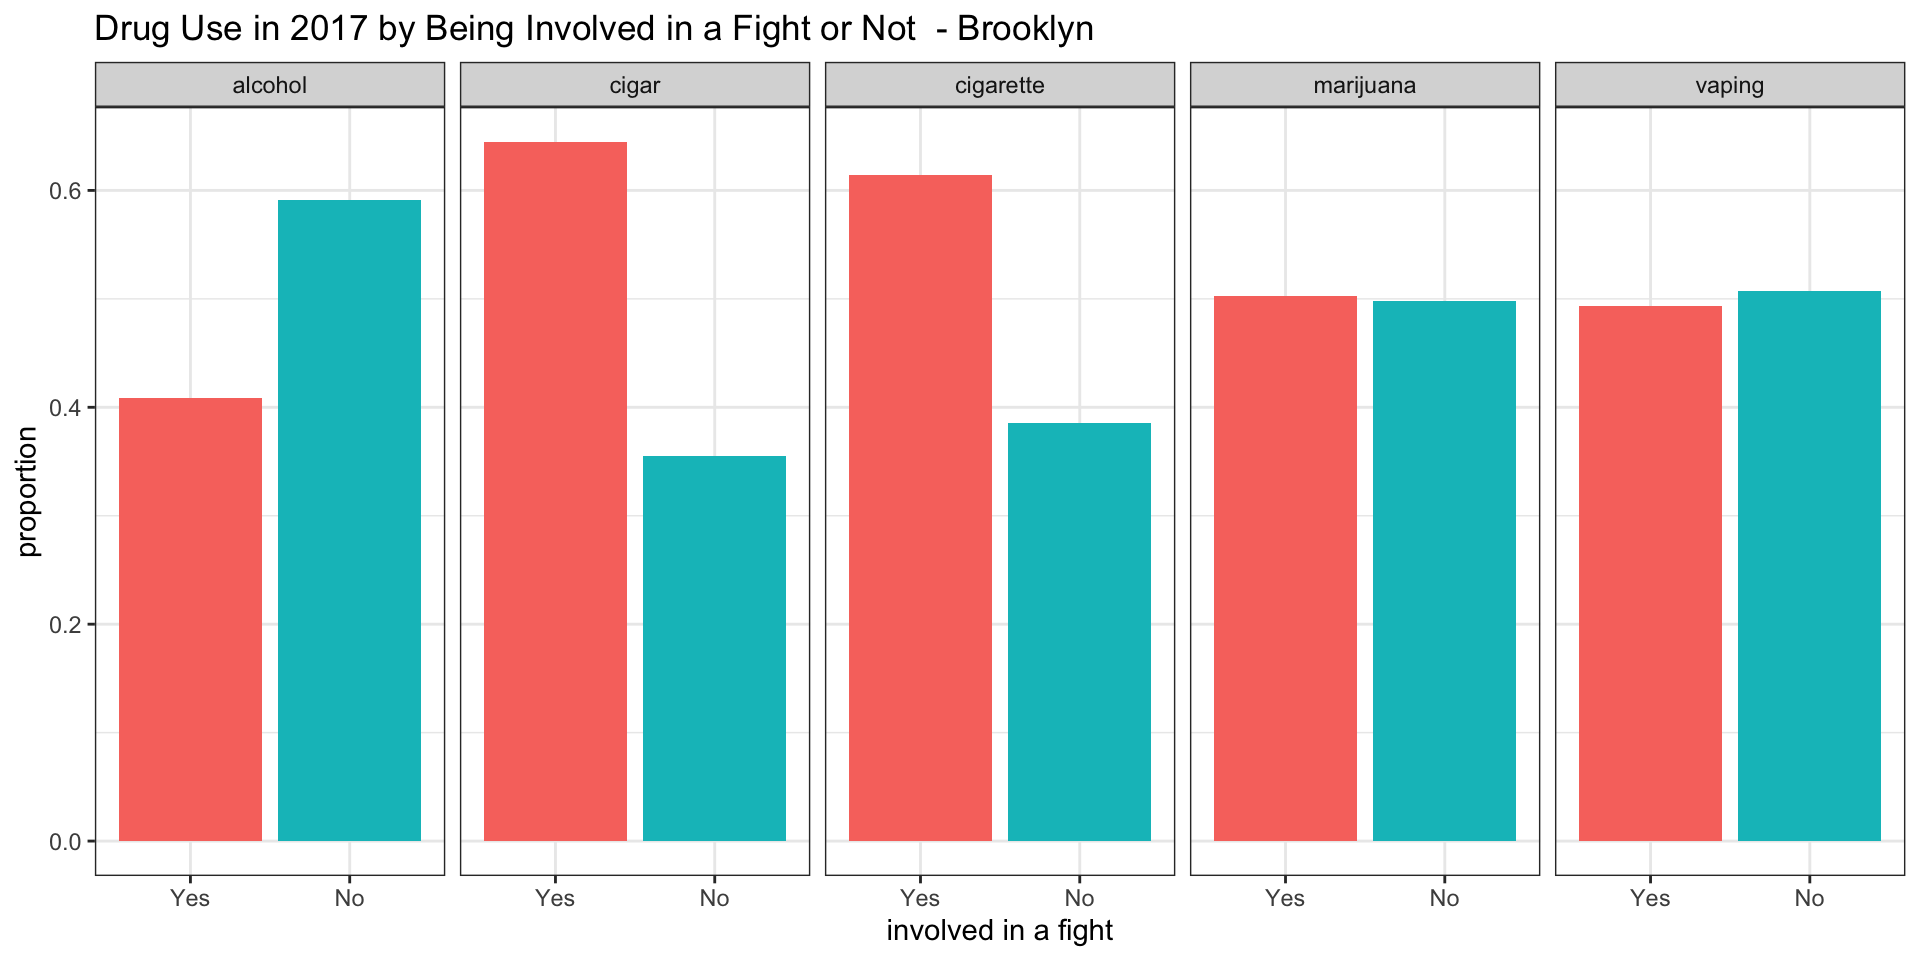
Brooklyn
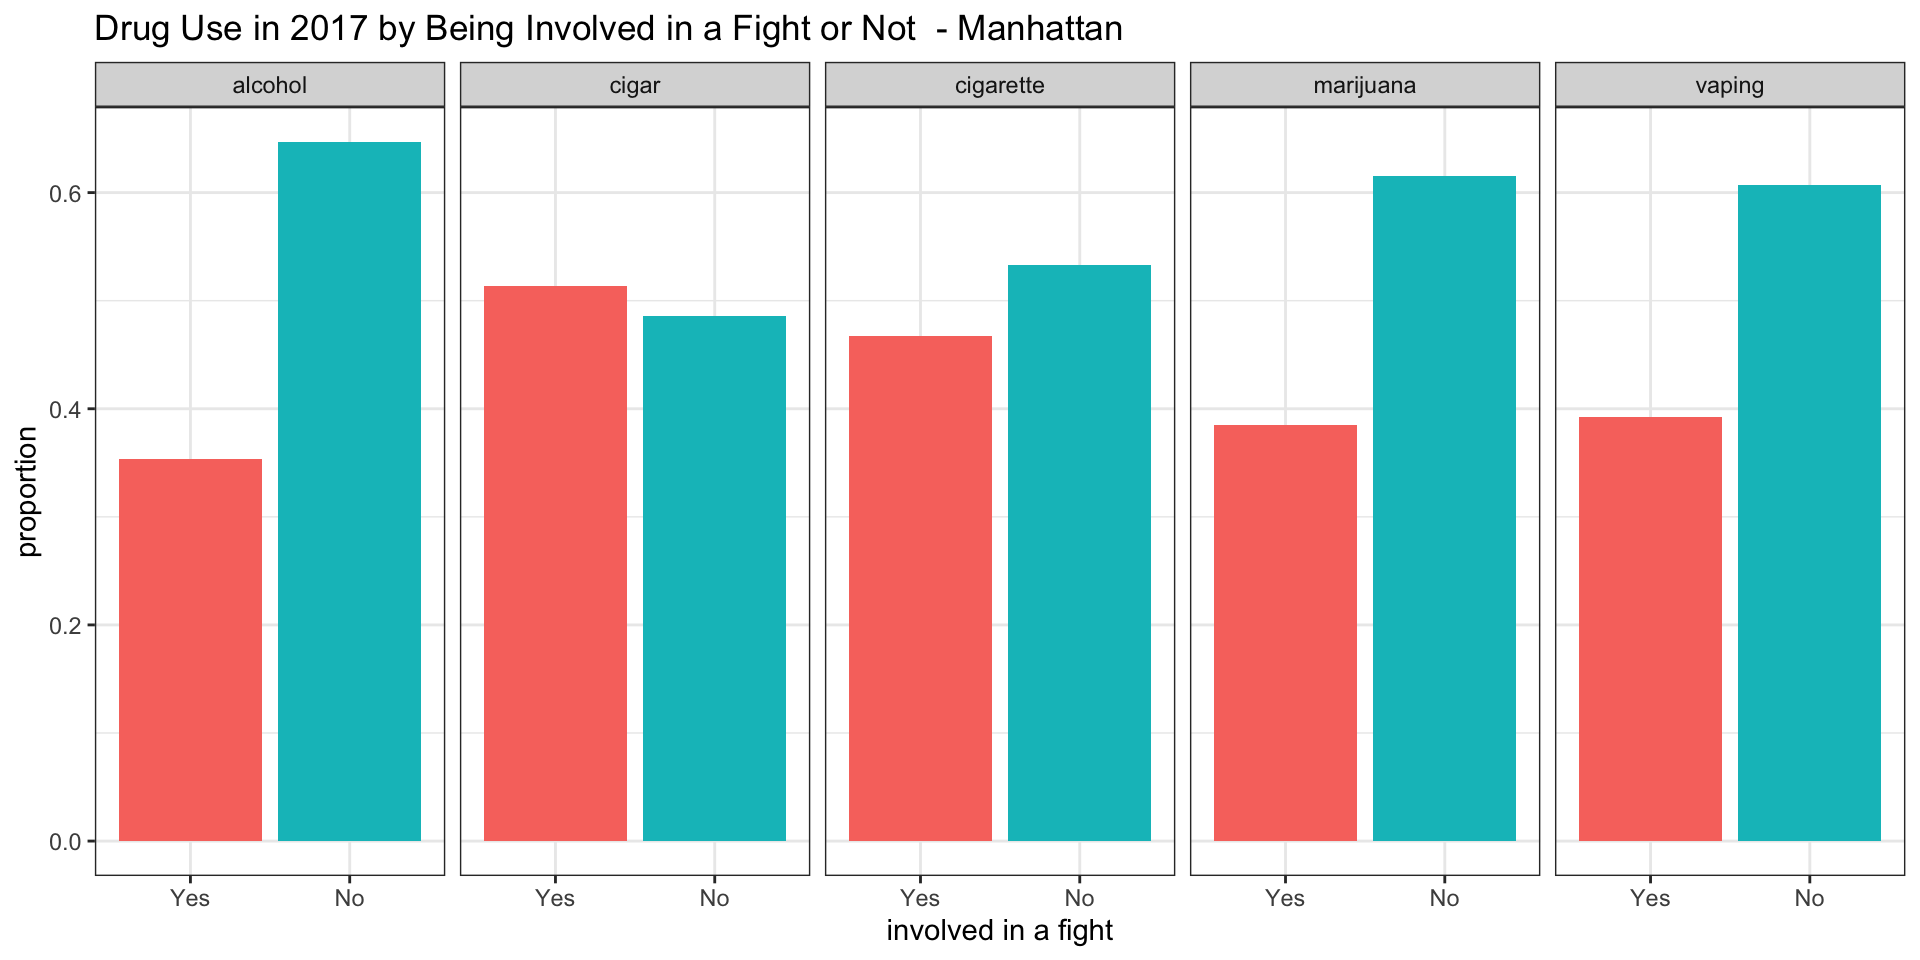
Manhattan
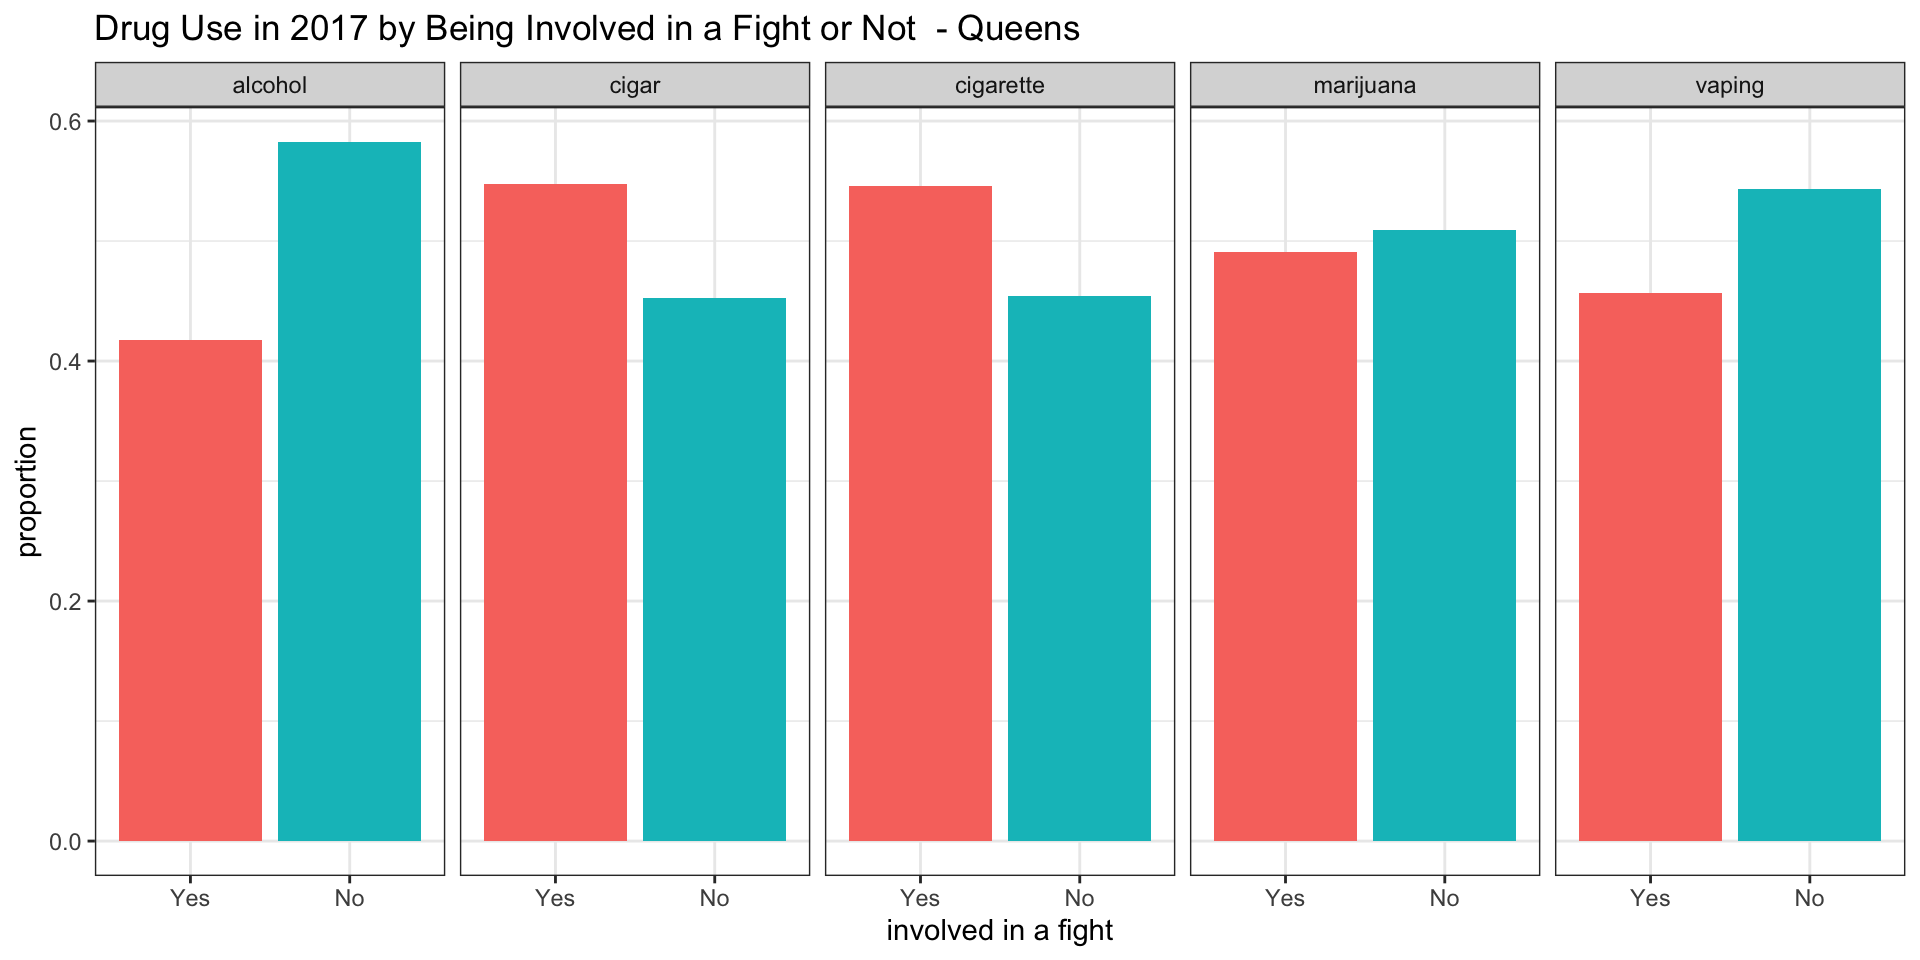
Queens
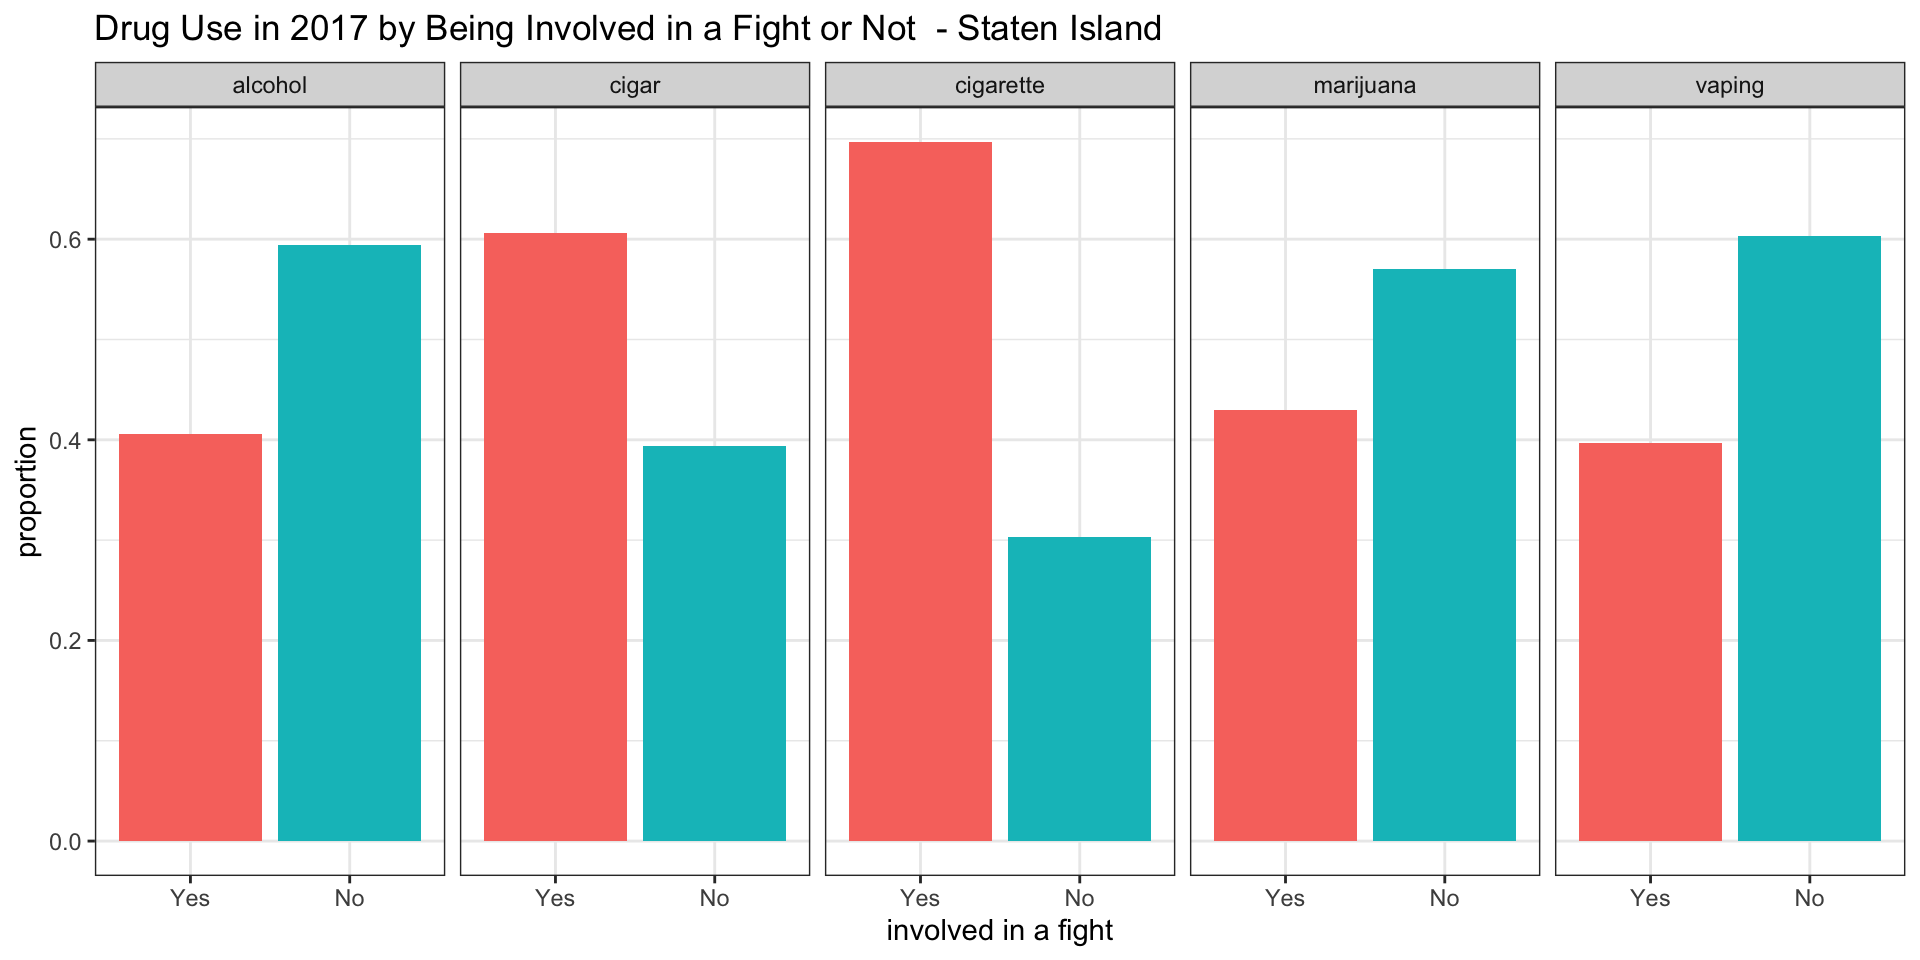
Staten Island
Interpretation
Studying these plots, we were able to derive the following interesting results:
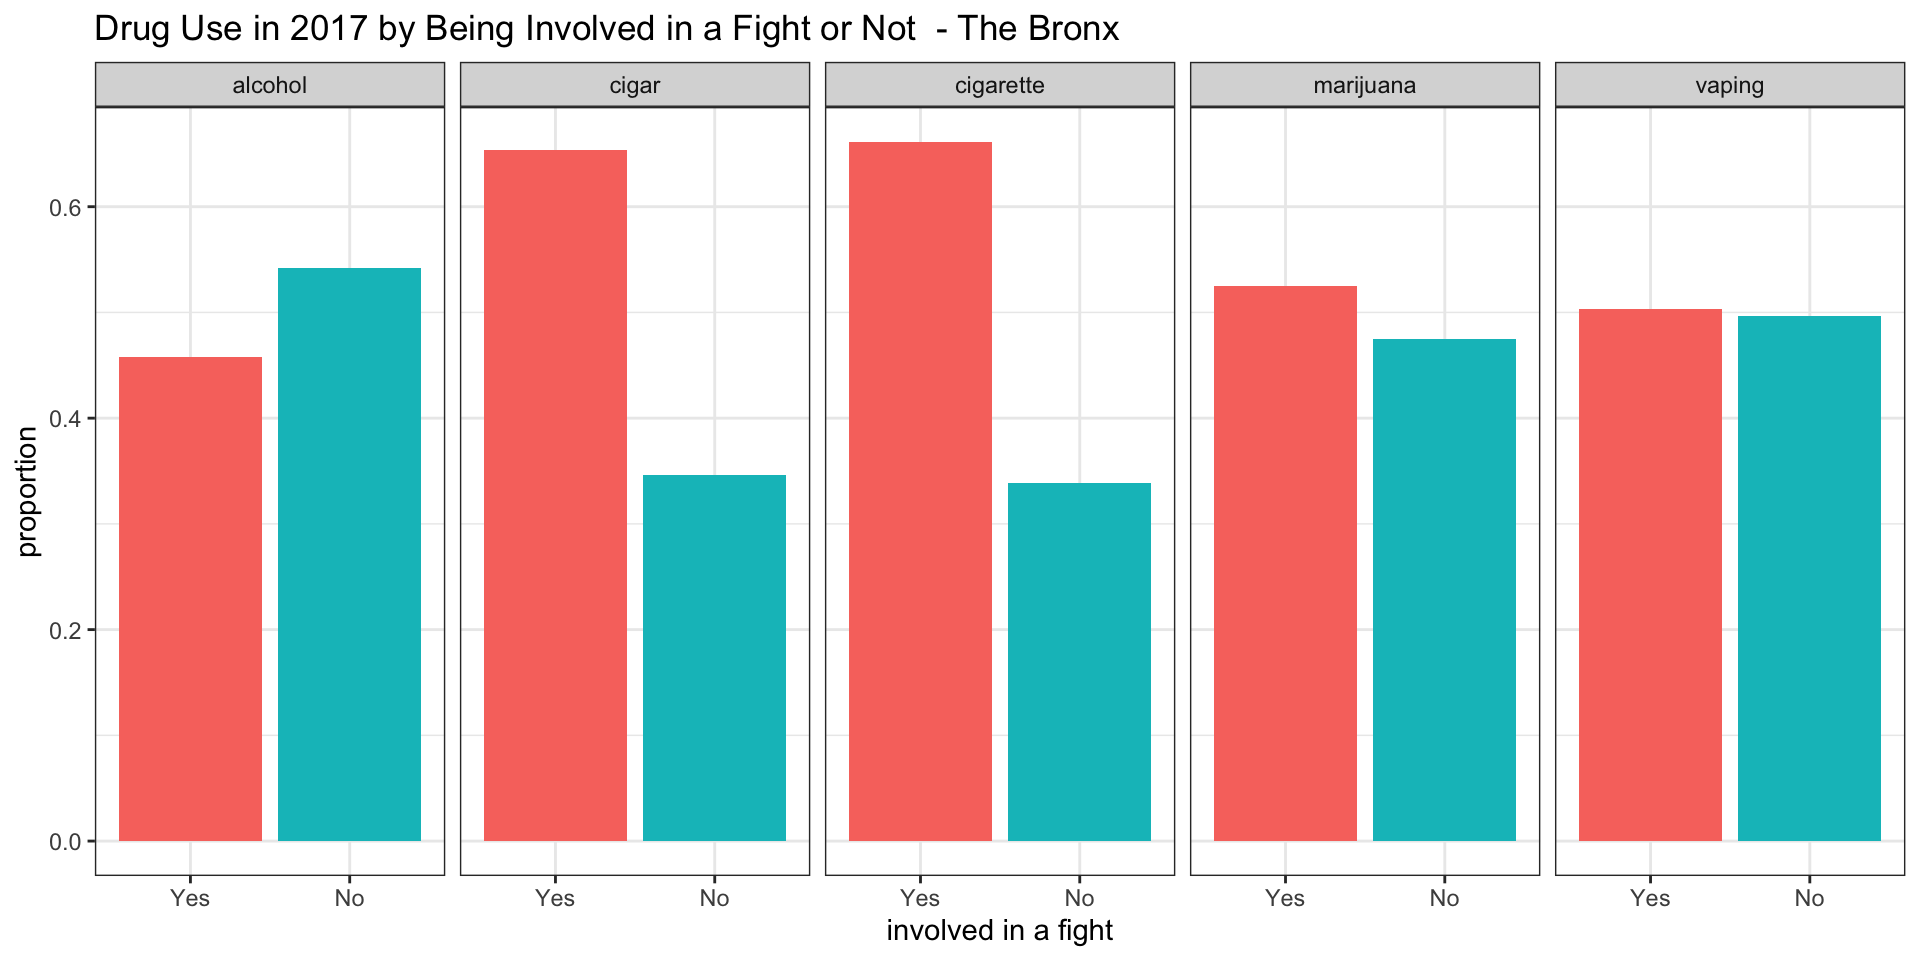
According to our survey data, it appears as if among teenagers consuming alcohol between 0.35 and 0.45 have been involved in a fight in all boroughs.
According to our survey data, it appears as if among teenagers smoking cigars between 0.55 and 0.65 have been involved in a fight in all boroughs.
According to our survey data, it appears as if among teenagers smoking cigarettes between 0.48 and 0.70 have been involved in a fight in all boroughs, with Manhattan having the lowest proportion of about 0.48
According to our survey data, it appears af if among teenagers smoking marijuana only in the Bronx the proportion of teenagers involved in a fight is above 0.5. For Brooklyn and Queens the proportion is about 0.5 and for Staten Island and Manhattan it is below 0.5.
According to our survey data, it appears as if among teenagers vaping the proportion of teenagers being involved in a fight is about 0.5 for the Bronx and Brooklyn, while it is below 0.5 in Manhattan, Queens, and Staten Island.
If this Exploratory Analysis sparked your interested, feel free to explore the data more using the Explore the Data tab on the top right corner of the website.